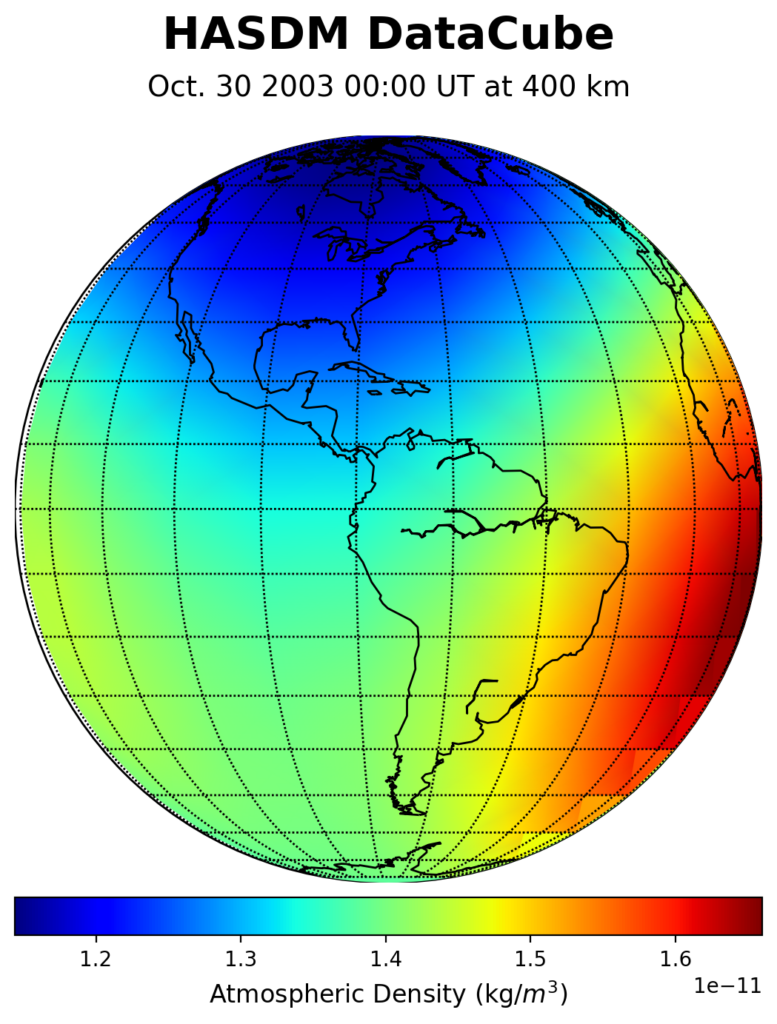
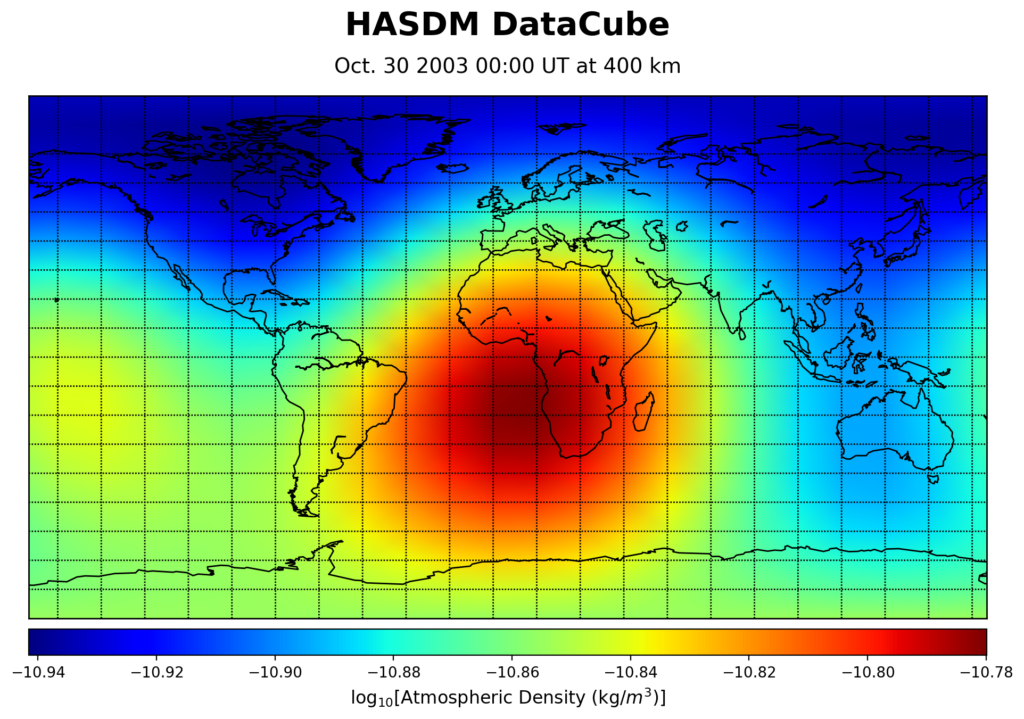
Halloween 2003 Plot
Global and regional disturbance snapshots from the Halloween storms.
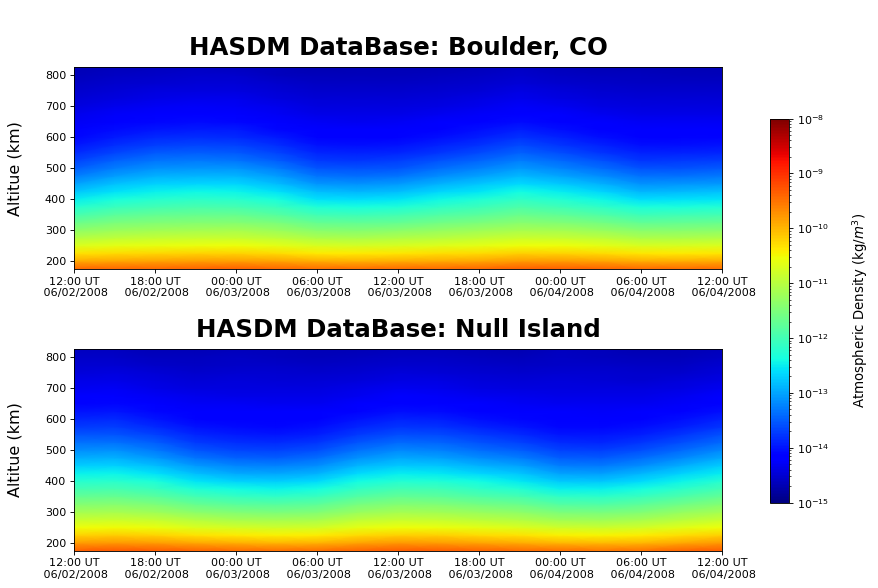
2 Day Plot
Two-day temporal evolution of key parameters.
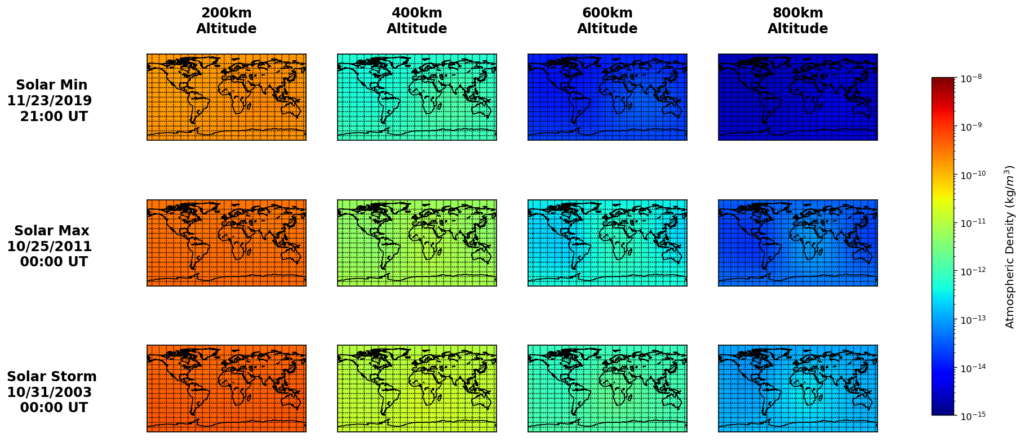
Solar Cycle Plot
Context across the solar cycle — table-to-map pairing.

Density Error Plots
Year-by-year σB diagnostics from 2000–2019.
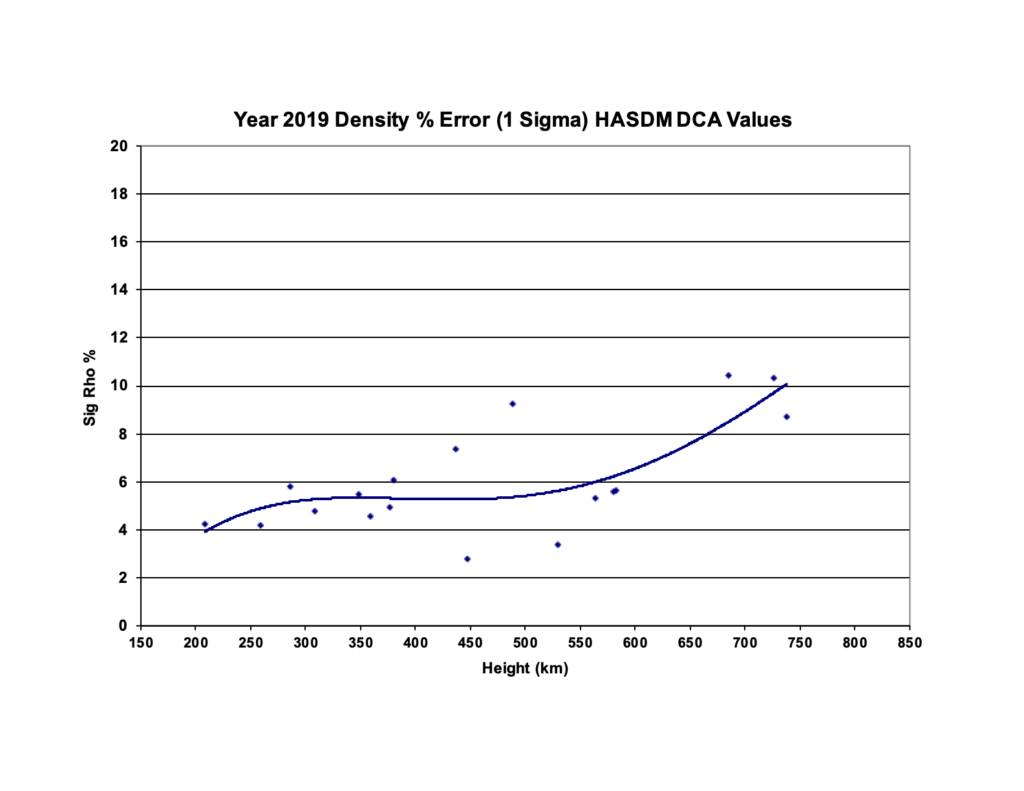
2019
σB diagnostics
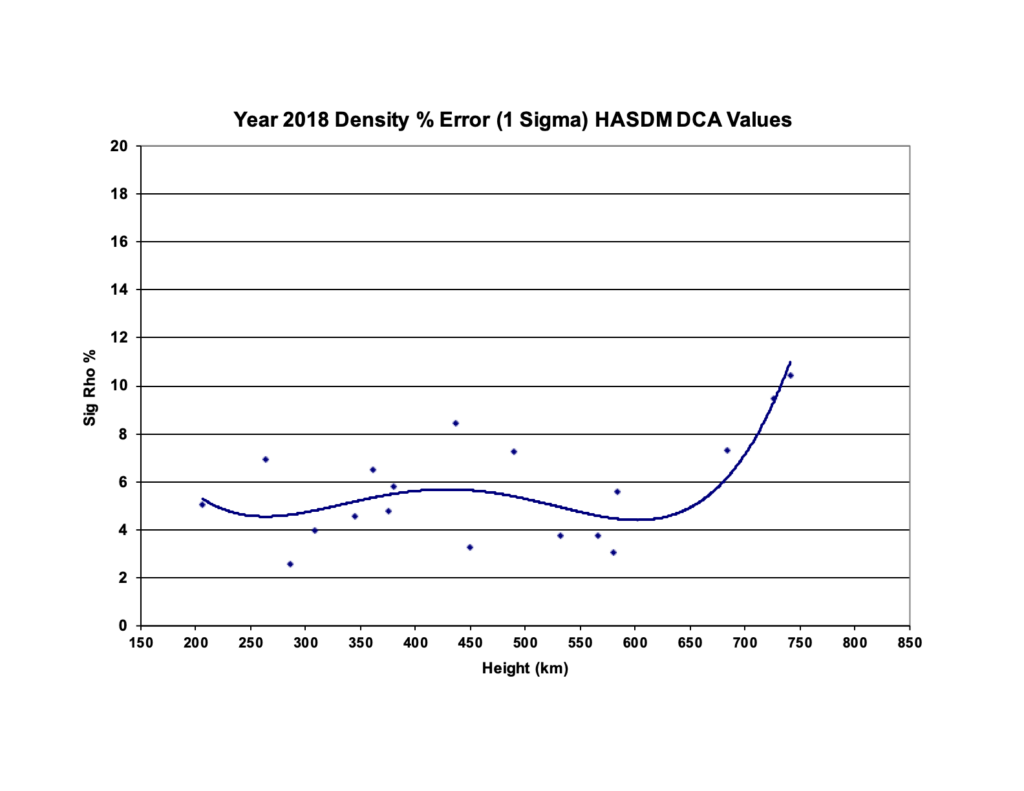
2018
σB diagnostics
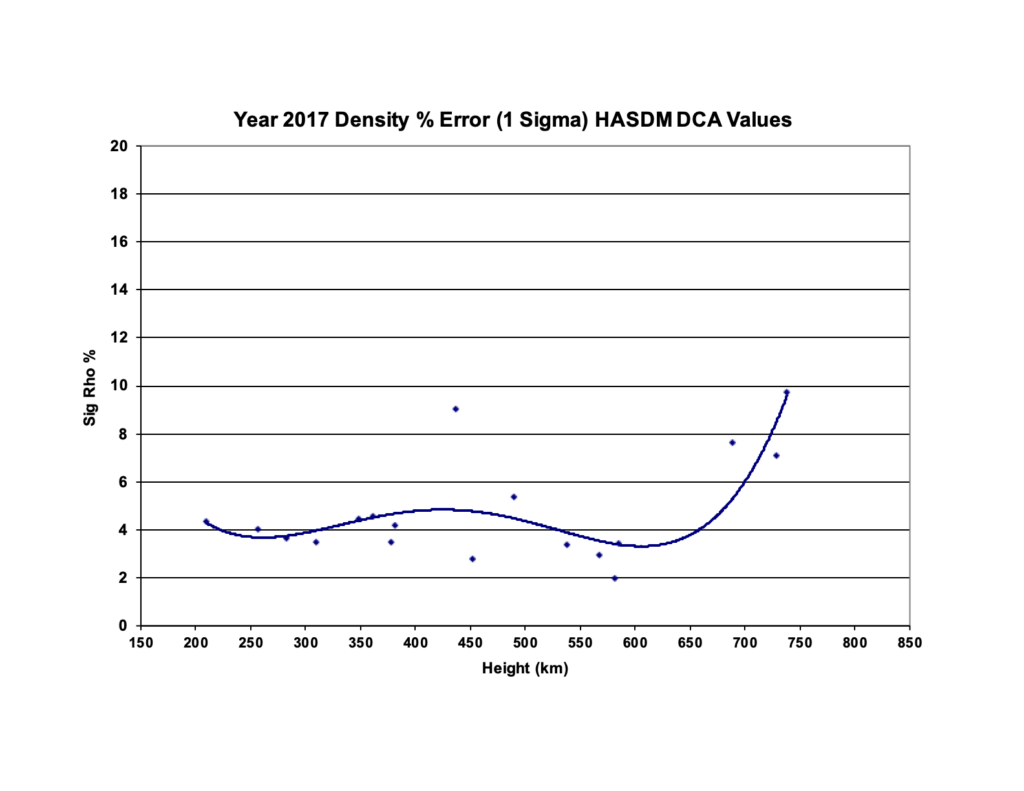
2017
σB diagnostics

2016
σB diagnostics
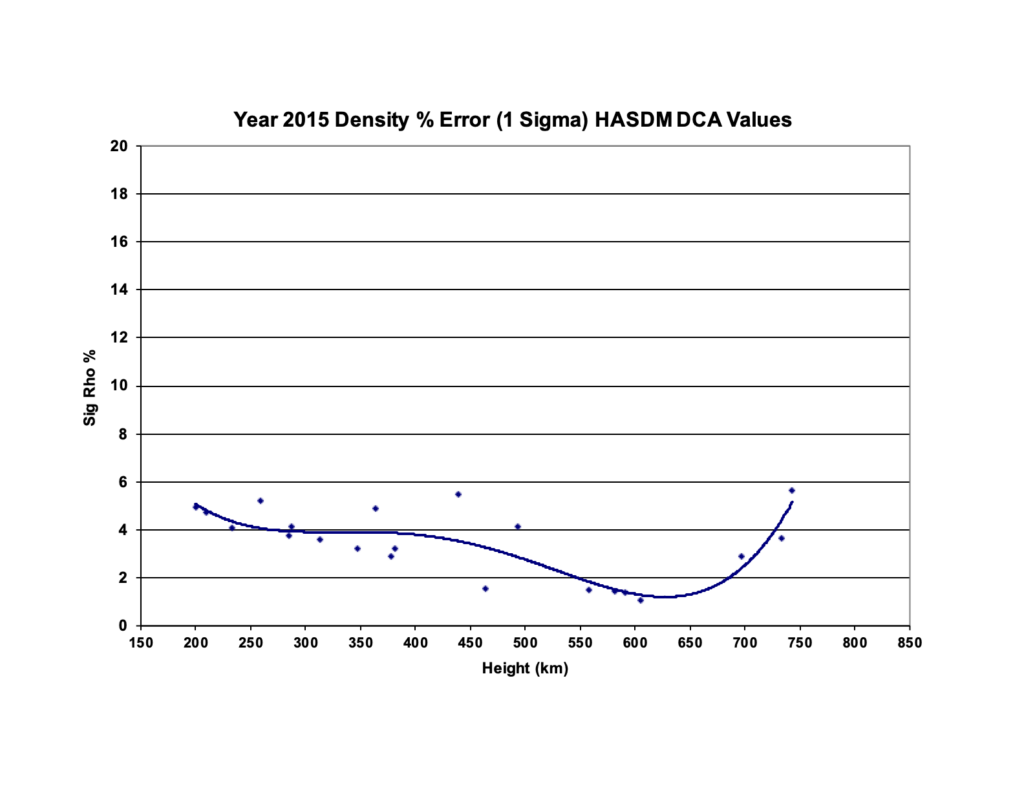
2015
σB diagnostics
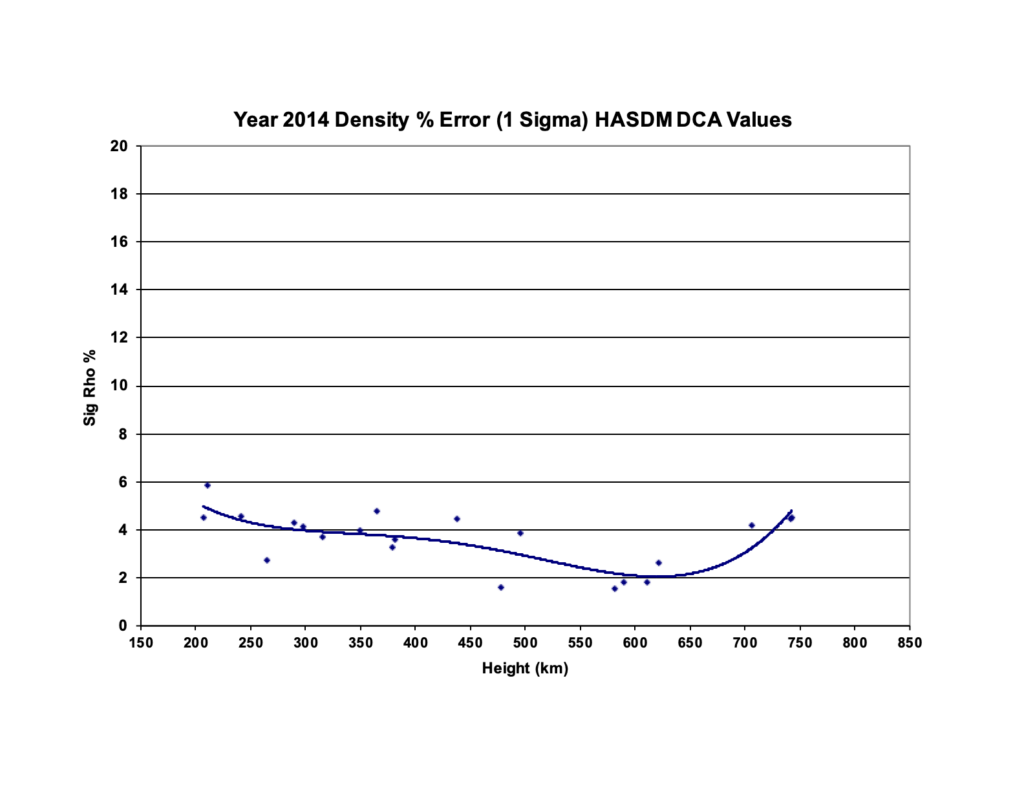
2014
σB diagnostics
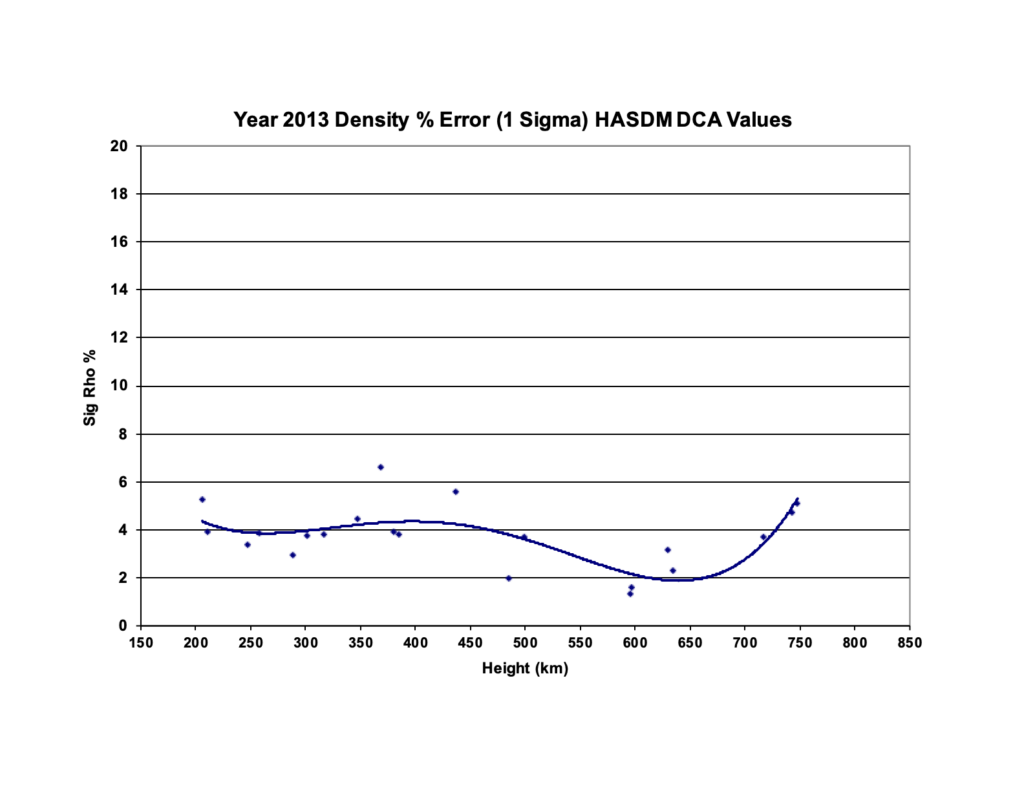
2013
σB diagnostics

2012
σB diagnostics
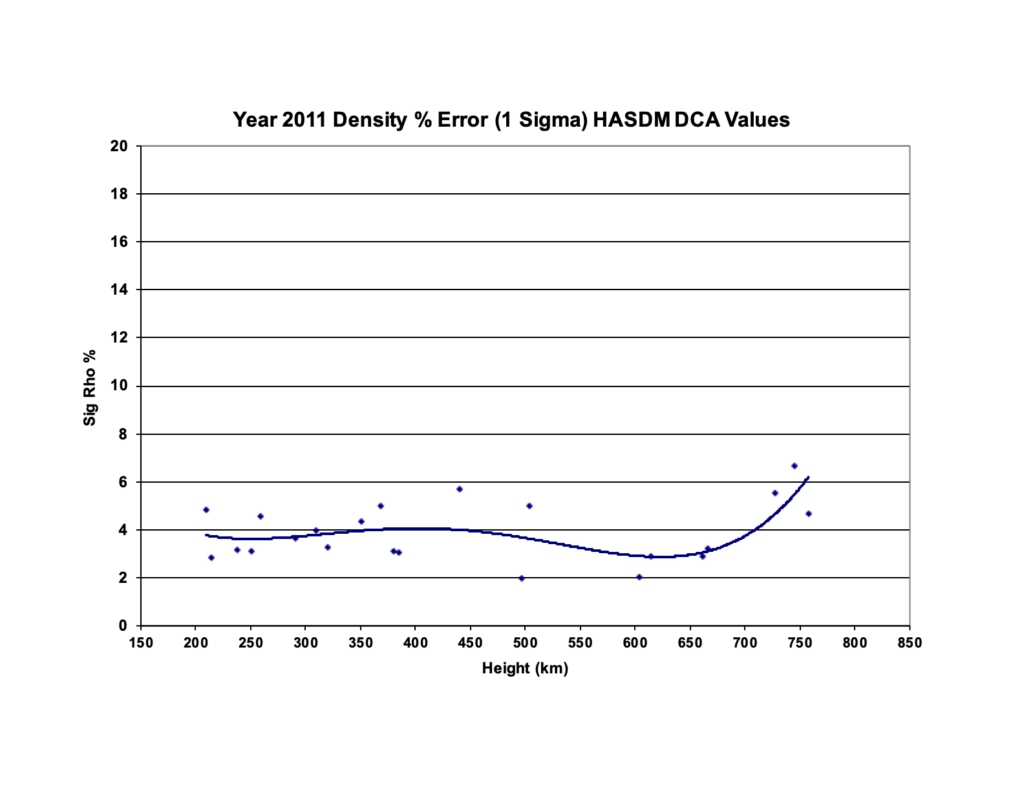
2011
σB diagnostics

2010
σB diagnostics
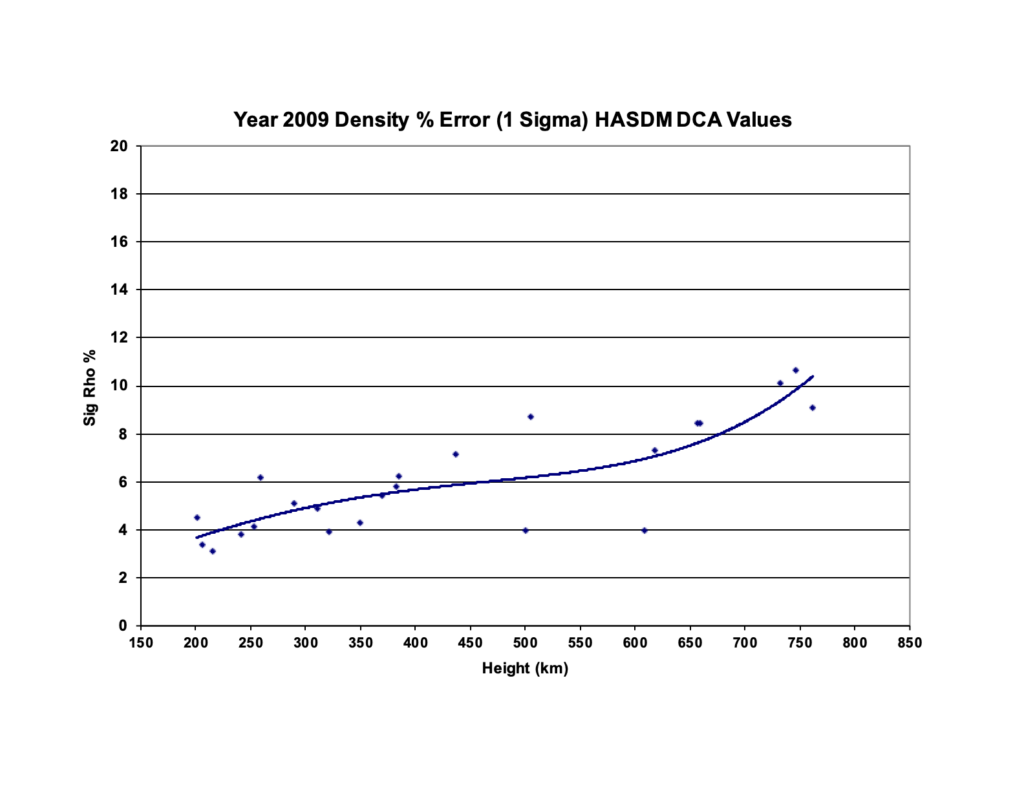
2009
σB diagnostics
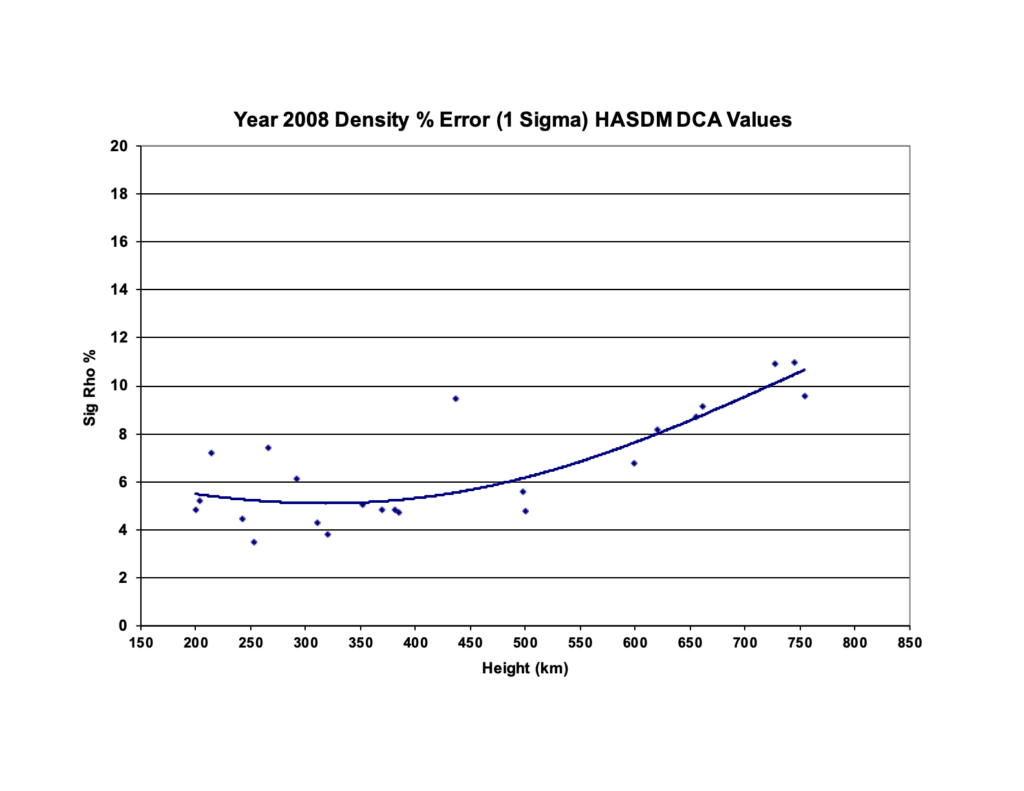
2008
σB diagnostics
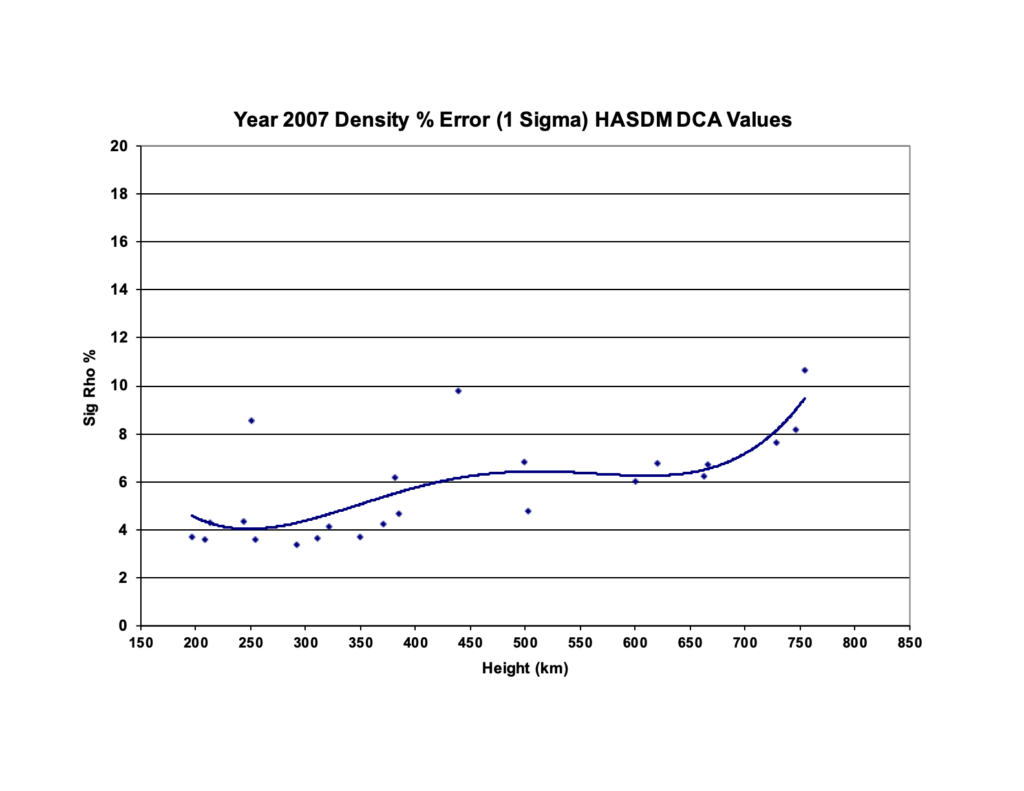
2007
σB diagnostics

2006
σB diagnostics
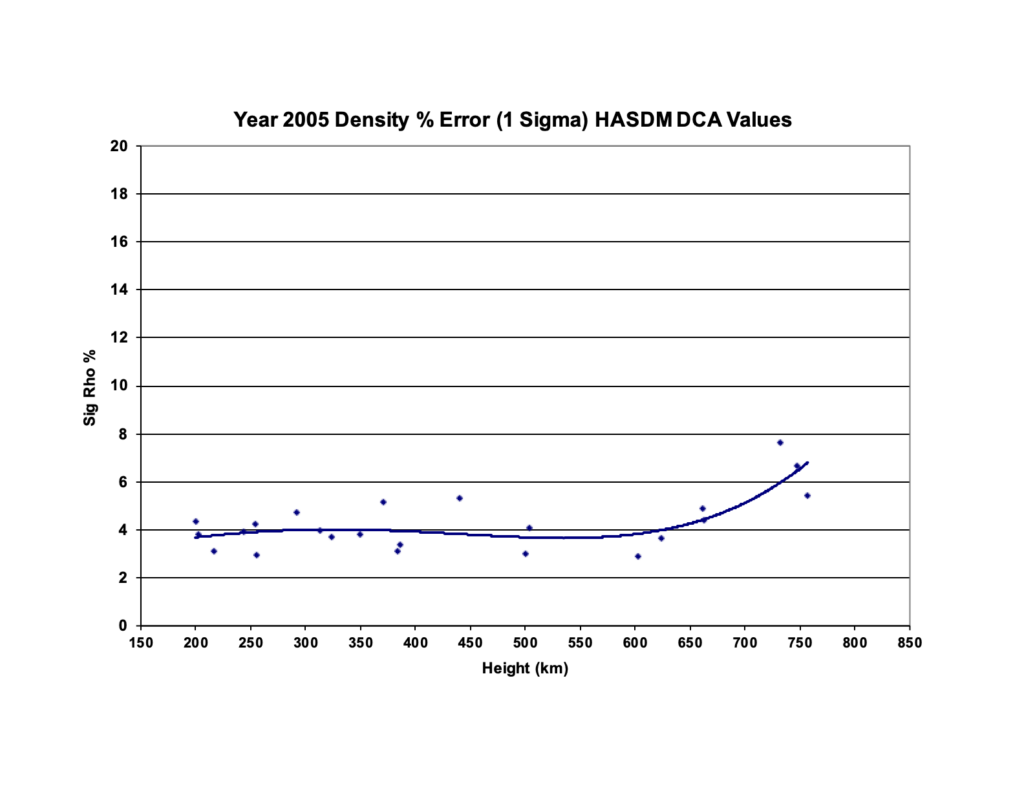
2005
σB diagnostics

2004
σB diagnostics
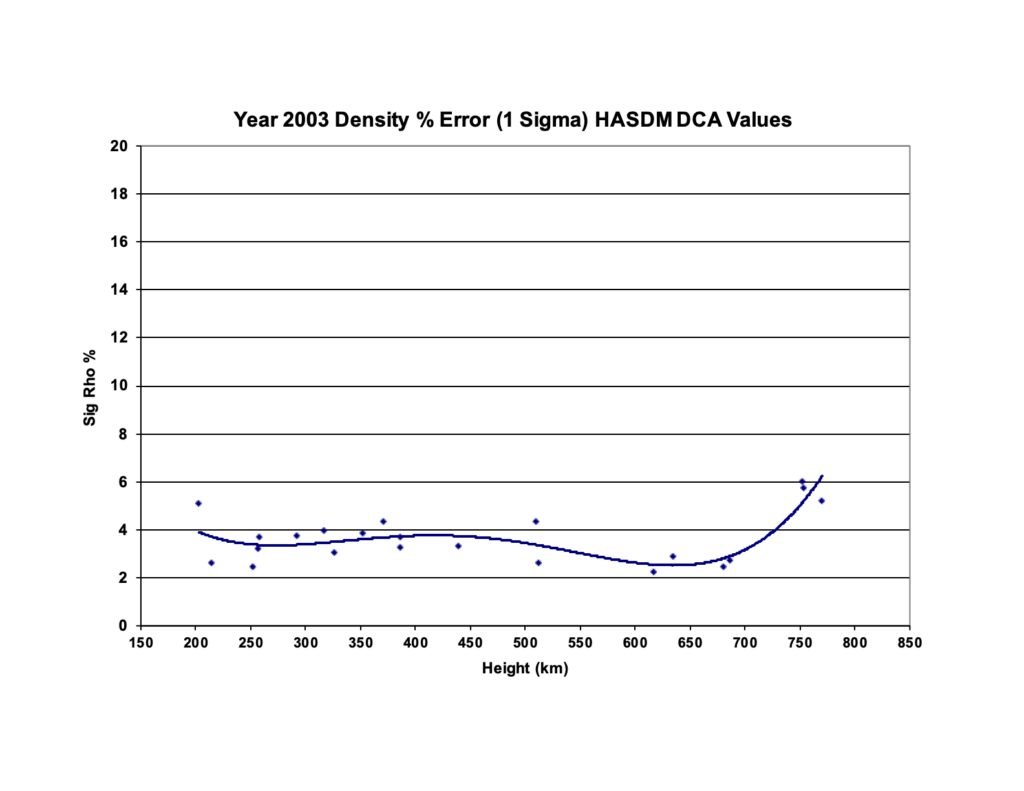
2003
σB diagnostics
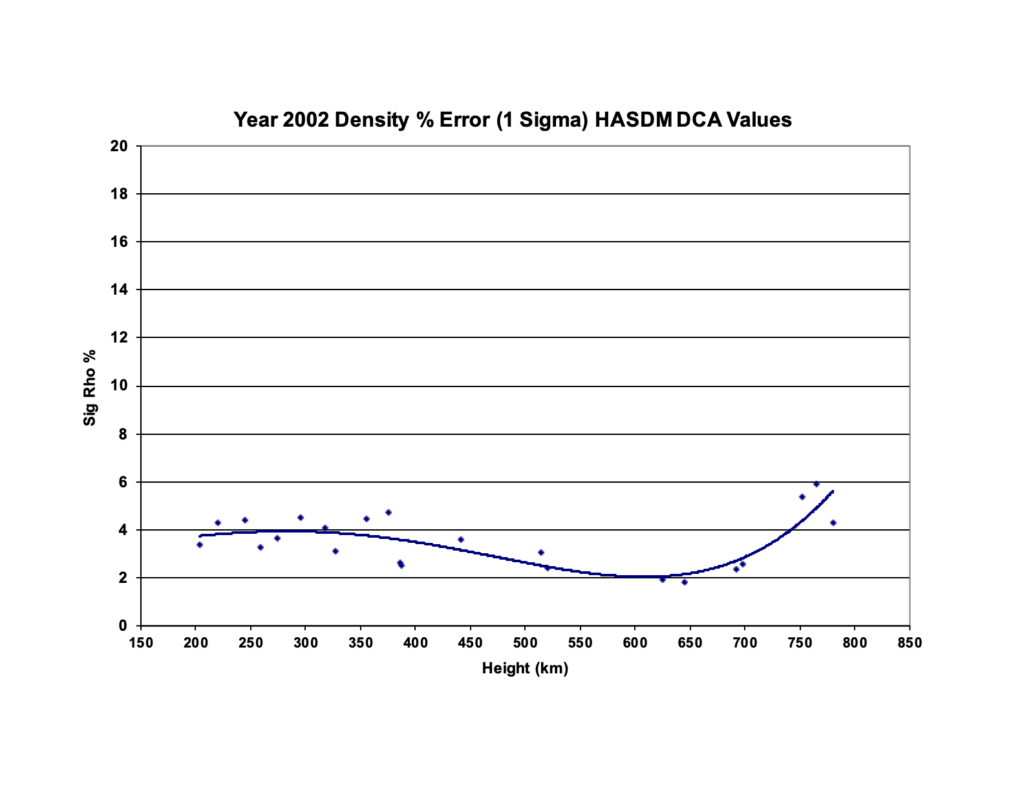
2002
σB diagnostics
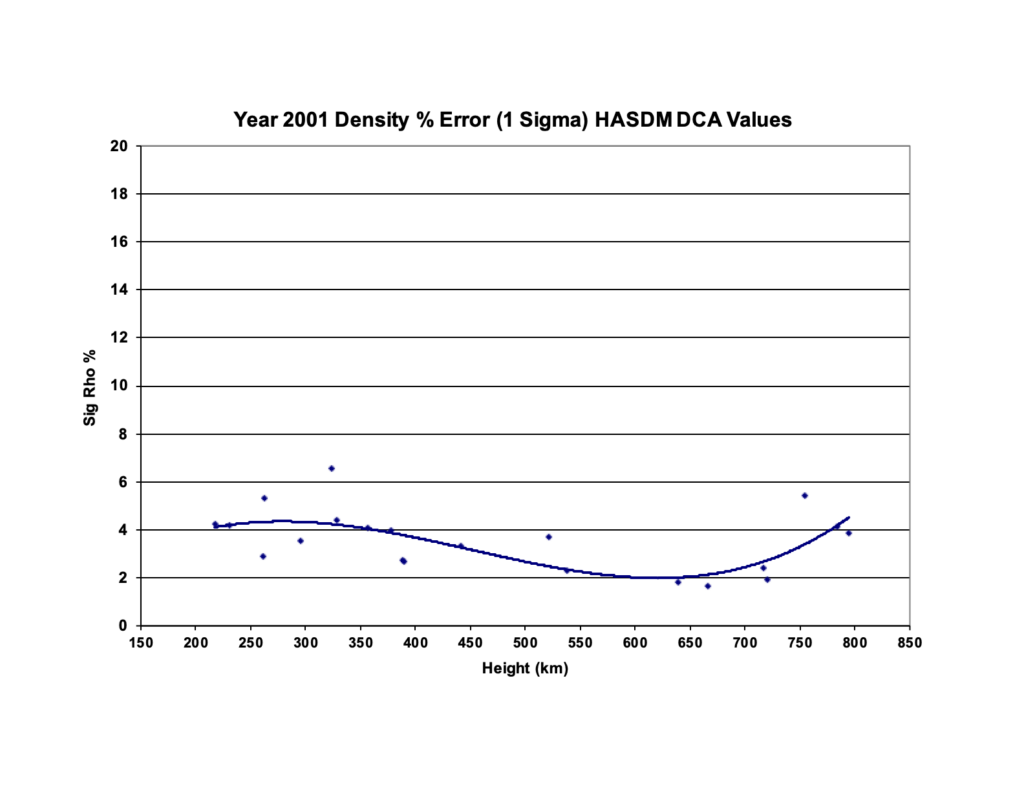
2001
σB diagnostics
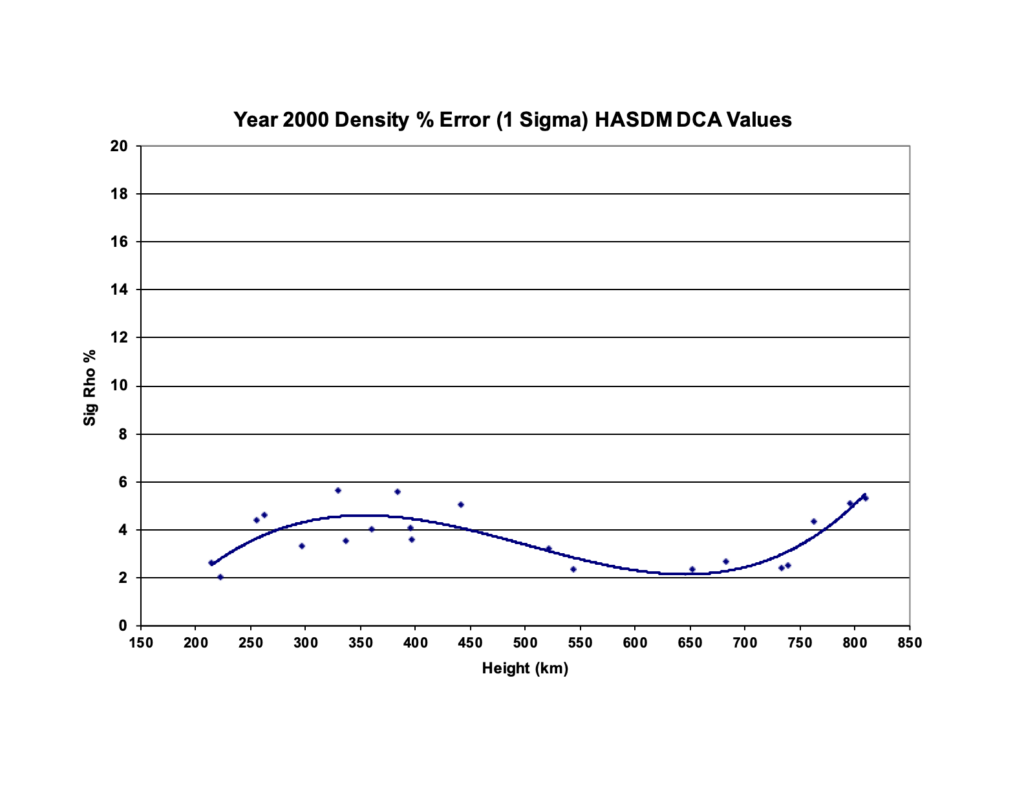
2000
σB diagnostics